Waste statistics and recycling rates

Amount of waste
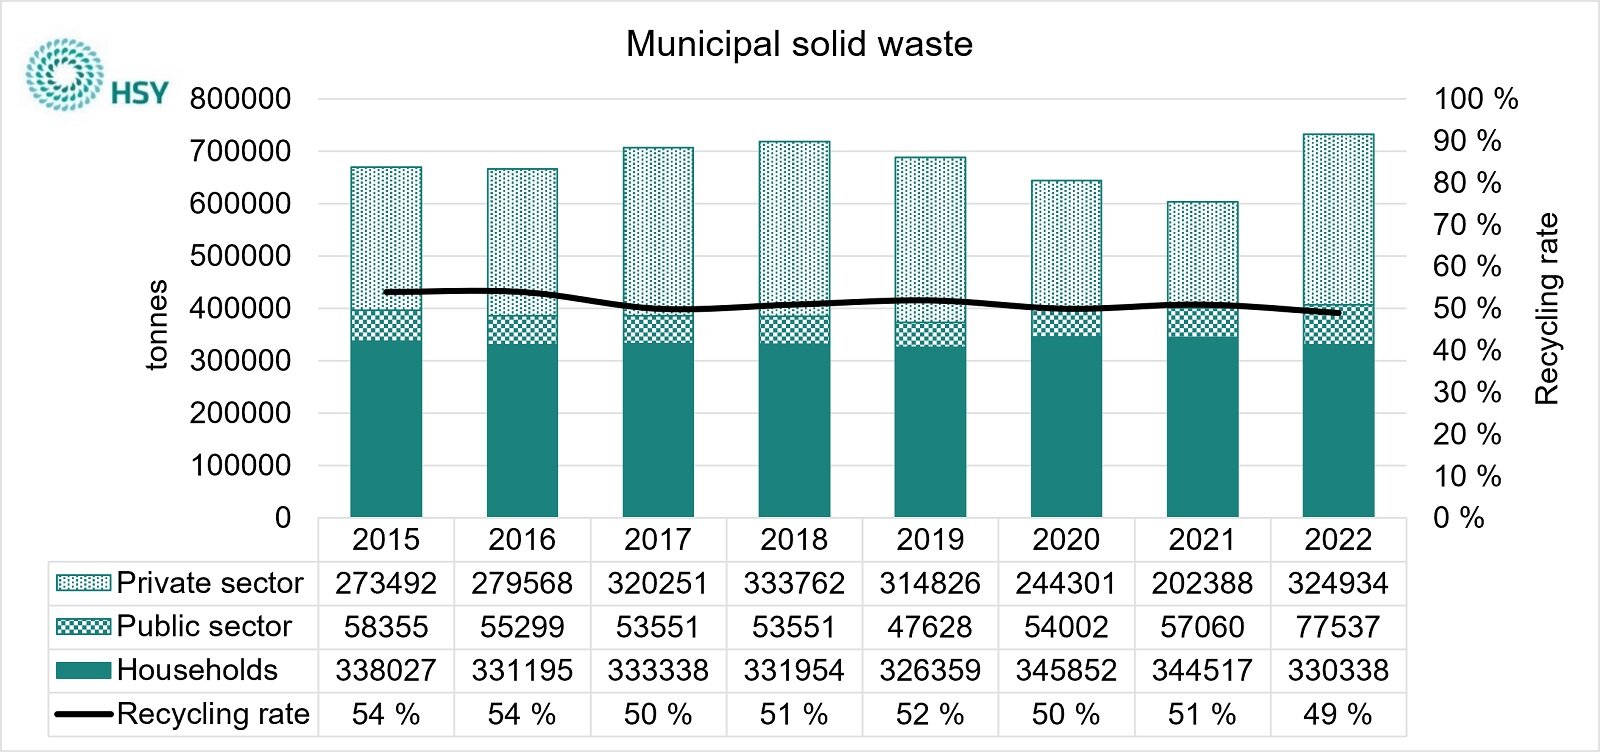
The Helsinki Metropolitan region and Kirkkonummi generated 733 000 tonnes of municipal solid waste (MSW) in the year 2022. This is 582 kg per capita. MSW is household waste and similar waste from the service sector.
According to statistics, the amount of MSW has increased back to the same lavel as it was before the coronavirus pandemic. The amount of household waste has decreased, but waste from private and public services has increased from 2021.
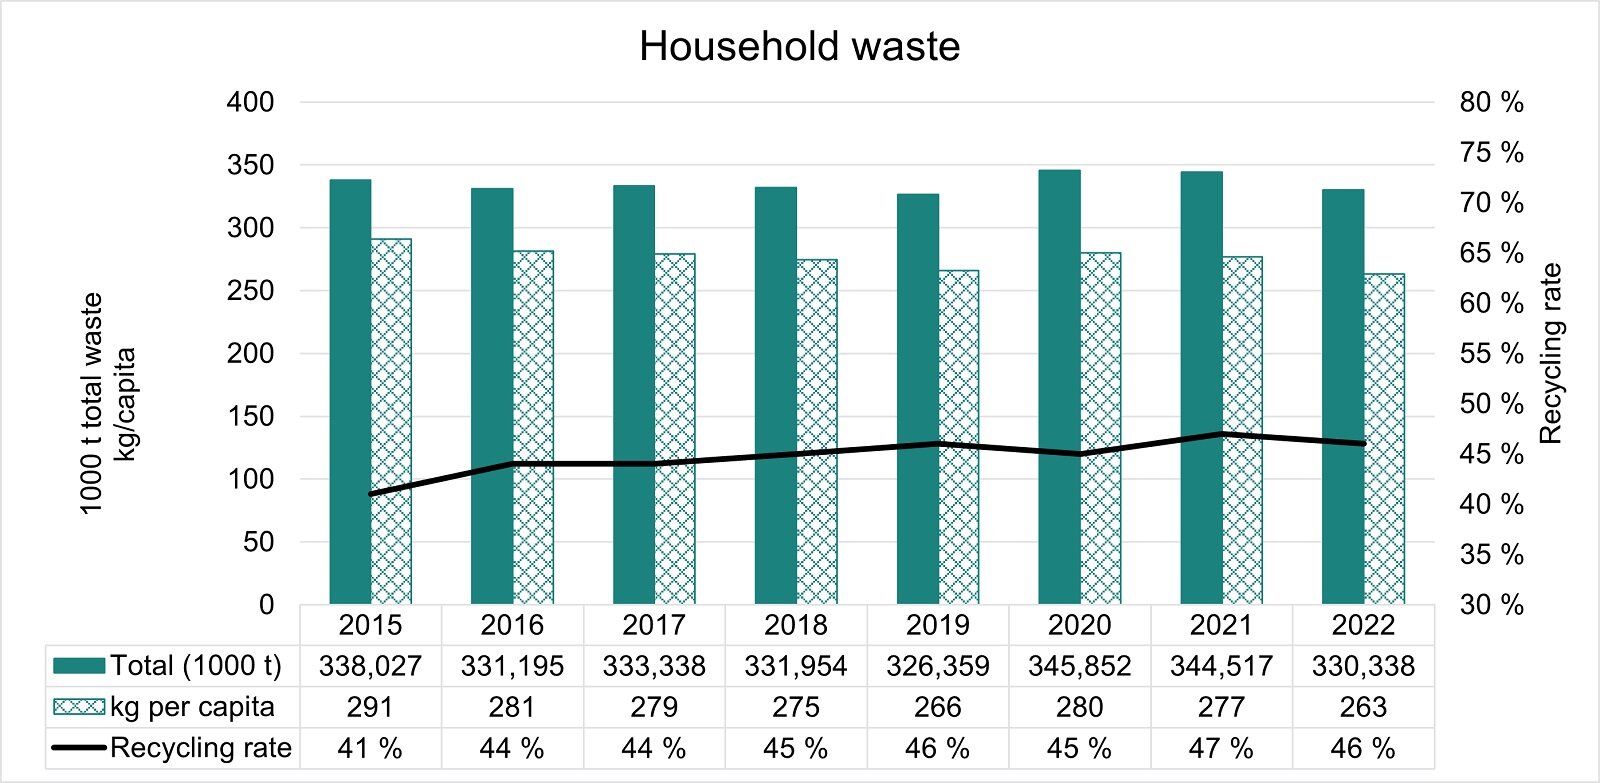
Household waste produced in the Helsinki Metropolitan region amounted up to 330 000 tonnes, which is 263 kg per capita, in year 2022. This is 14 kg less than the previos year.
City specific household waste statistics
| Region | Helsinki | Espoo | Vantaa | Kauniainen | Kirkkonummi | |
| kg per capita | 263 | 261 | 249 | 272 | 294 | 325 |
| change of kg per capita | -14 | -12 | -17 | -16 | +10 | -23 |
| recycling rate | 46% | 47% | 48% | 44% | 51% | 43% |
| change of recycling rate | -1% | 0 | 0 | 0 | +3% | -3% |
Every other year we produce statistics of other waste streams than household and MSW waste in the region. Most of the waste generated in the region is land masses from construction, which amounted to 66 % of all the waste generated in the region in year 2022. Waste from the other sectors were as follows; building construction waste 11 %, household waste 6 %, private service sector 6 %, energy sector 6 %, industry 2 %, waste water management 2 % and other public sector 1 %. See waste produced by sector here (.xlsx).
Recycling rate
Of the household waste generated in the Helsinki Metropolitan region and Kirkkonummi, 46 % in recycled. The rest is incinerated with energy recovery. Household waste do no longer end up in landfills. The calculation of the recycling rate takes into account the rejects from the recycling processes. The goal is to increase the recycling of household waste. This would require more effective and better sorting of the waste where is it is generated, so that more waste goes to recycling, and less waste to incineration.
The recycling rate of all municipal solid waste was 49 % in 2022. Less than 1 % went to landfills or other, and rest was incinerated with energy recovery. The recycling rate of all MSW is higher than that of households due to better sorting of biowaste in the private service sector.
Type of waste
Of the municipal solid waste is 44 % mixed waste. This means 256 kg per capita of mixed MSW.
47% of the household waste consists of mixed waste, which makes 124 kg per capita. Most of this waste could have been sorted, a big part of the mixed waste consists of biowaste and plastics. The mixed waste is incinerated with energy recovery, whereas the sorted waste mostly is recycled as material.
| Municipal solid waste 2022 | Municipal solid waste (t) | Municipal solid waste (kg/capita) | Household waste (t) | Household waste (kg/capita) |
| Mixed waste | 323000 | 256 | 157000 | 124 |
| Bio waste | 125000 | 99 | 38000 | 30 |
| Carton | 94000 | 75 | 19000 | 15 |
| Paper | 50000 | 40 | 34000 | 27 |
| Glass | 25000 | 20 | 18000 | 14 |
| Metals | 27000 | 21 | 18000 | 14 |
| Wood | 22000 | 18 | 6000 | 5 |
| Plastics | 21000 | 16 | 12000 | 10 |
| Other | 46000 | 37 | 28000 | 24 |
| Total | 733000 | 582 | 330000 | 263 |
Household mixed waste composition
A household mixed waste composition study in the Helsinki metropolitan area is carried out every three years. The results are published as open data (in Finnish).
Over a third of the mixed waste consists of biowaste. According to the study in 2021, some 40 % of the total amount of mixed waste was biowaste, when including soft tissue paper.The majority, 80 %, of the mixed waste could have been recycled if sorted.

Household mixed waste composition study in the Helsinki metropolitan area 2021,
Household mixed waste composition study in the Helsinki metropolitan area 2021