The tightened recommendations for air quality by WHO pose new challenges even to Finland
Air pollution concentrations in Finland exceed most of the values of WHO's new air quality guidelines. The situation is the worst with nitrogen dioxide from exhaust emissions of transport.
The World Health Organisation WHO has updated its air quality guidelines. The new guidelines were made to protect health. They are strict even for Finland, which is well known for its good air quality. For example, the concentrations of nitrogen dioxide in the largest Finnish cities can be even two or three times as high as the new WHO guideline values. In Finland, concentrations of fine particles, inhalable particles and ozone are also largely harmful to human health.
To update the guidelines, WHO has analysed new research data on the health effects of air pollutants accumulated since 2005. The guidelines are meant for global use. WHO encourages highly polluted countries with a number of milestones.
Reaching the new guideline values is realistic in Finland
According to international comparisons, air quality in Finland is good, but air pollution can sometimes affect air quality even here.
- In Finland, the pursuit of these new, more stringent guideline values is still realistic. However, the concentrations of fine particles and ozone are heavily influenced by their long travelling distance and reducing these concentrations can only be achieved through European and global emission control measures, says Pia Anttila, Research Scientist at the Finnish Meteorological Institute.
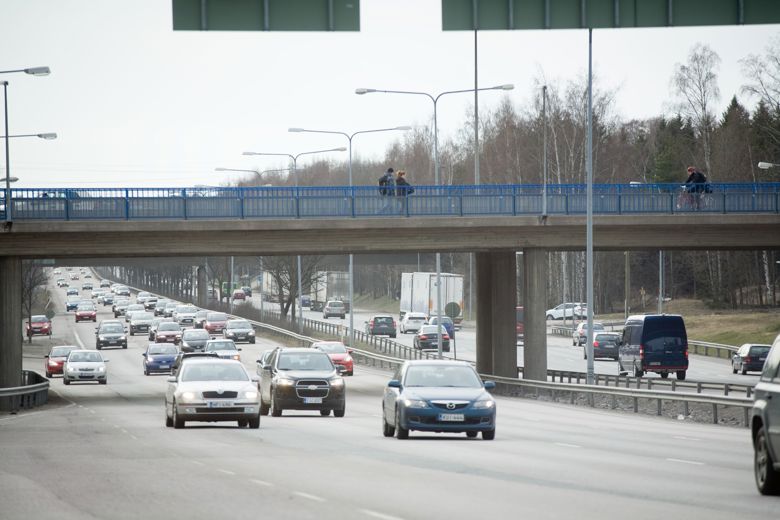
On the other hand, road transport emissions such as nitrogen dioxide (i.e., exhaust gases) and inhalable particles (i.e., street dust), are a local problem. Their concentrations can be reduced by local measures. WHO guidelines are exceeded especially in busy urban environments. For example, the annual concentration values of nitrogen dioxide in the busiest streets of the Helsinki city centre are approximately three times higher than the guideline value.
- Emissions of exhaust gases are declining with new low-emission vehicles, but street dust will remain a problem also in the coming decades. Reducing particulate emissions from small-scale wood burning is also slow, says Hanna Manninen, Head of Air Quality Unit at Helsinki Region Environmental Services HSY.
WHO also recommends measuring the quantitative concentrations of black carbon and particulate matter even though they have not yet been given guideline levels. In Finland, these have been measured for a long time at the background stations of the Finnish Meteorological Institute, at the research stations of the University of Helsinki, and in the Helsinki Metropolitan Area at the measurement stations of HSY. The concentrations of black carbon are increased especially by small-scale wood burning and emissions from old diesel cars.
More evidence of health effects of air quality at low concentration levels
As air quality has improved globally, it has been confirmed that air pollution affects health already at low concentrations.
- The updated WHO guidelines are based on strong evidence of the adverse health effects of long-term exposure when concentration guideline levels are exceeded. However, adverse health effects have also been observed at lower concentration levels than those in guidelines, says Senior Researcher Otto Hänninen from the Finnish Institute for Health and Welfare.
The Finnish Meteorological Institute has compiled a report on the state of air quality in Finland in relation to the new WHO guidelines. The report is based on statutory monitoring results the quality of which has been assured. The monitoring is carried out by cities (partly in cooperation with industry) and the Finnish Meteorological Institute.
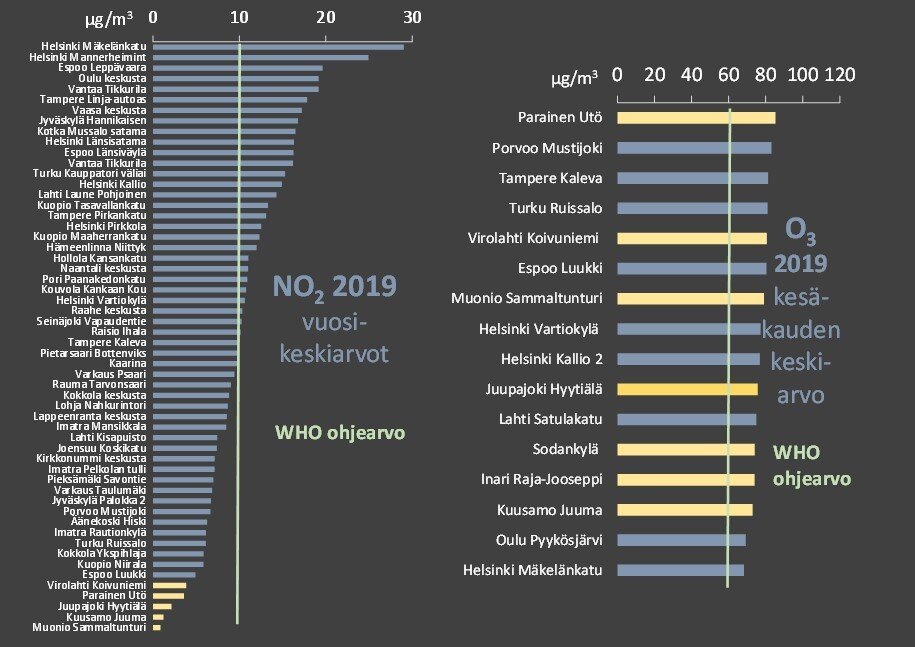
Annual average values of nitrogen dioxide (NO2) and summer season average values of ozone (O3) at air quality monitoring stations in 2019 compared to the corresponding WHO guideline levels. The blue bars stand for stations located in cities or near cities and industry. The yellow ones stand for background stations located far away from emission sources.
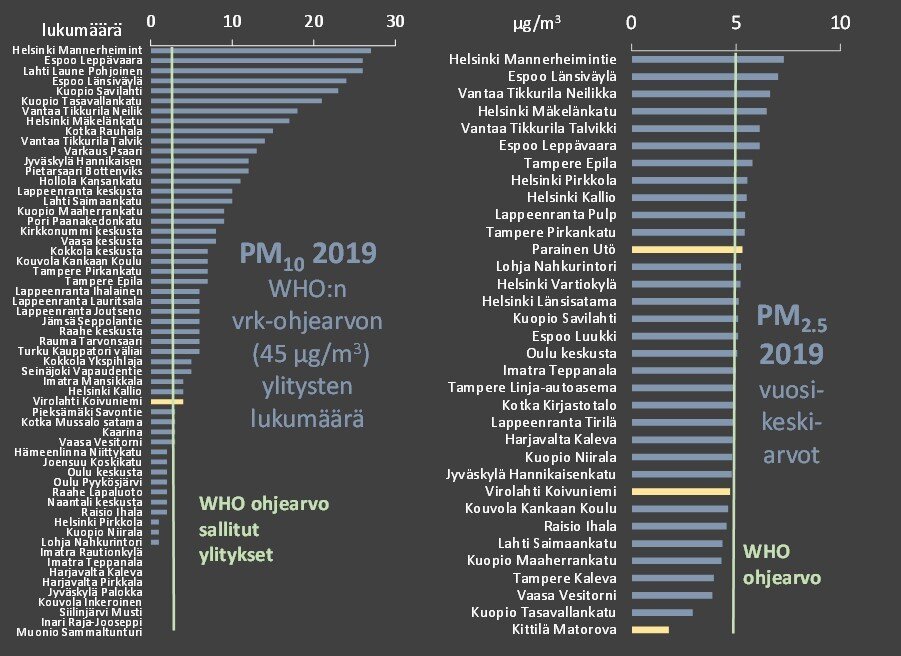
Number of days above the WHO guideline levels for inhalable particles (PM10) per station in 2019 (left). The annual average levels of fine particles (PM2.5) compared to the corresponding WHO guideline level. The blue bars stand for stations located in cities or near cities and industry. The yellow ones stand for background stations located far away from emission sources.
Lisätietoa:
- WHO global air quality guidelines report 2021
- Overview of air quality regulations (in Finnish)
- Air quality now
- Monitoring of Finnish air quality