HSY’s material and nutrient flows

HSY's material and nutrient flows describe the materials and nutrients that pass through HSY, as well as the ways in which these are utilised.
HSY’s material flows and material balance

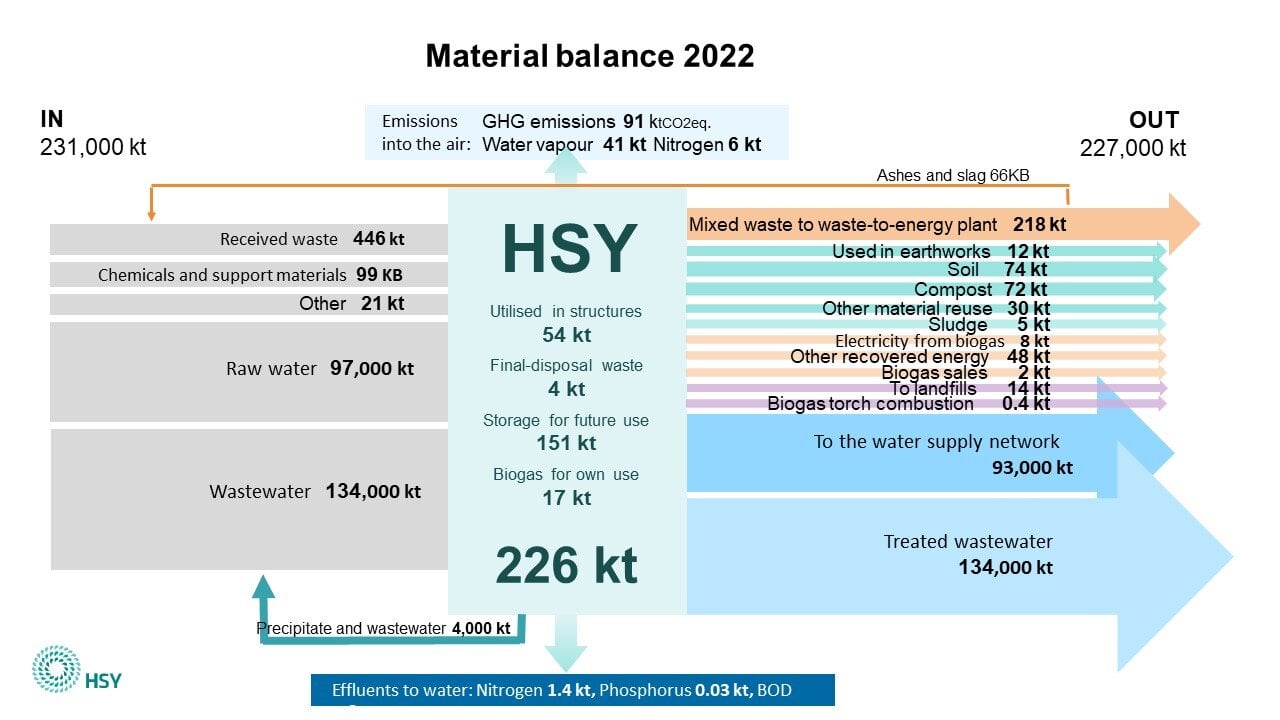
In 2022, we received approximately 231 million tonnes of material, which is approximately 3% less than in 2021. Up to 99% of the material we receive is water. We received a total of 532,000 tonnes of solid materials, most of which were waste. The amount of waste received has decreased by 13% compared to the previous year. Waste types that have decreased include, for example, slag received from waste-to-energy plants and mixed waste collected from properties.
Less than 1% of all waste received ended up in a landfill. In 2021, we utilised a total of approximately 54,000 tonnes of different masses in the landfill and environmental structures of the Ämmässuo Waste Treatment Centre and in the trenches of the regional water supply network. In addition, we collected a total of approximately 26,000 tonnes (35 million cubic metres) of biogas from the digestion of biowaste and wastewater treatment sludge and landfill gas collected from the Ämmässuo Waste Treatment Centre. The gas was mainly recovered as energy, which was used in HSY’s own operations or sold as electricity to the national grid.
In 2022, HSY’s outbound material flow was approximately 227 million tonnes. The amount of outgoing material has also decreased by approximately 4 per cent from 2021. More than 99% of the outbound material was treated supply water and wastewater. We processed biowaste and sludge into soil and compost. We directed recyclable materials, such as metals, glass, cardboard and plaster, to material recovery by other operators. We also directed minerals from waste-to-energy plant slag, as well as soil and aggregates to earthworks.
The information as open data.
Breakdown of the material balance
Inflows
- Received waste: Different waste types received by Sortti Stations and the Ämmässuo Waste Treatment Centre, as well as mixed waste collected from properties (excluding materials from Ekomo operations or packaging waste collected from the property, as HSY is not responsible for the treatment of these).
- Additives in composting: additives used in the composting of mainly sludge (for example, peat, sand, litter manure, biotite, humic substance)
- Chemicals and support materials: Chemicals, support materials and fuels used in the Ämmässuo Waste Treatment Centre, in water and wastewater treatment and in the composting of sludge
- Pipe network volumes and materials: pipe materials and excavation volumes
- Raw water: purified raw water
- Wastewater: includes both invoiced wastewater and leaked water into the wastewater network
HSY bar
- Materials used in structures: in both landfill and other environmental structures (permanent placement)
- Final-disposal waste: amount of final-disposal waste in landfills
- Storage for future use: stored waste and materials, for example, waste bales, blasted rock
- Biogas for own use: biogas from the digestion of biowaste and wastewater treatment sludge and gas collected from the final disposal area of the Ämmässuo Waste Treatment Centre and the old landfill, which HSY utilises internally
Outflows
- Mixed waste to the waste-to-energy plant: waste delivered to the plant from properties
- For earthworks: for example, blasted rock, slag minerals and soil masses used in earthworks or in landfill structures outside of HSY
- Topsoil: Metsäpirtti soil products
- Compost: compost produced from the processing of biowaste and digestion of sewage sludge
- Other recovered material: non-biological waste directed to operators external to HSY for recycling (for example, metals, glass, cardboard, WEEE)
- Sludge: sludge directed to outside HSY
- Biogas for electricity production: electricity produced from biogas to the national grid (converted into tonnes)
- Other recovered energy: waste directed to other energy recovery processes (for example, hazardous waste, wood chips)
- Biogas sales: biogas sold to outside HSY
- To landfills: Materials generated by HSY in connection with excavation within the networks and delivered to the landfill site
- Biogas torch combustion: unutilised biogas
- To the supply water network: includes approved use and leakage water
- Treated wastewater: volume of treated effluent to the sea
Limitations
The material balance is an indicative calculation. The initial information for the calculation has been collected from databases, our own annual reports and our experts. The calculation covers the material flows of HSY’s own operations, i.e. the materials used in our processes (water treatment, wastewater treatment, sewerage and water supply networks, waste management), the materials we have received and sent for processing, as well as the materials remaining and stored in our area. Individual construction projects and, for example, office supply purchases have been excluded from the calculation, as have all material flows that fall below 10 tonnes per year.
Materials in stock distort the balance, as materials ending up in stock are not necessarily discharged during the same calendar year, and the weight of the materials in stock varies as a result of evaporation and precipitation.
Material balance figures cannot be used directly, for example, for calculating the regional recycling rate, as material flows include also other flows than waste flows. Regional waste flow information can be found behind the link in the right hand-side bar.
HSY’s nutrient streams and nutrient balance
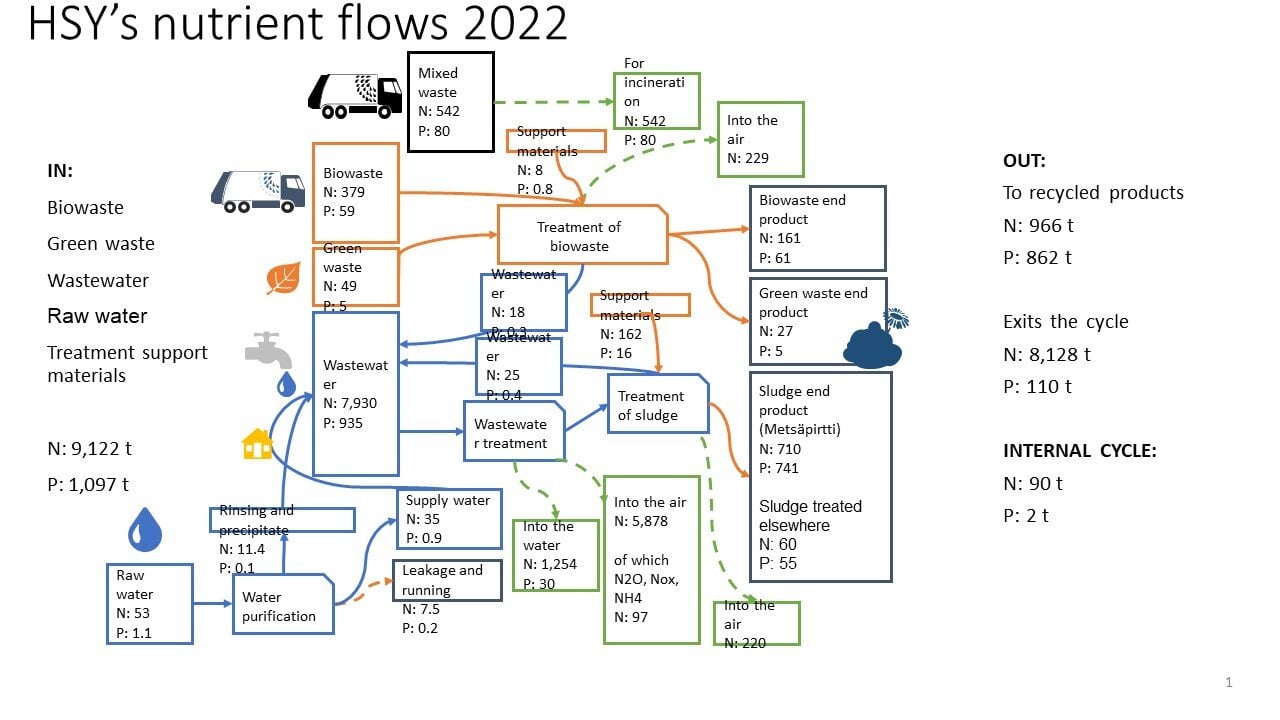
We utilise the bioenergy contained in biowaste and sewage sludge in our own operations and recycle nutrients as compost and soil products. The nutrient flow diagram helps to detect at which stages of the cycle we can prevent nutrient loss, as well as how different changes in the processes or sources of nutrients are reflected in the nutrient cycle. The nutrient balance is a simplified calculation of the extent to which nutrients (N and P) are returned to the circulation through these processes.

According to the nutrient balance calculation, the amount of nutrients returned to the circulation by HSY in 2022 was 966 tonnes for nitrogen and 862 tonnes for phosphorus. The volumes have slightly decreased from the previous year. In general, the level of circulation is good and we have made efforts to minimise environmentally harmful waste flows in treatment processes. For comparison: In Finland, approximately 152,000 tonnes of nitrogen and 11,000 tonnes of phosphorus are used as inorganic fertilisers annually (source: Sitra 2022).
| Total nutrients | Incoming (t) | Internal circulation (t) | External circulation (t) | Exits the circulation (s) |
| Nitrogen (N) | 9,122 | 90 | 966 | 8,182 |
| Phosphorus (P) | 1,097 | 2 | 862 | 110 |
The nutrient cycle of phosphorus is at a good level, and approximately 90 percent of the received phosphorus continues from HSY in a form that enables the nutrient cycle. The amount of phosphorus in the treated wastewater discharged into the nature by HSY’s wastewater treatment plants is below the national recommendation.
The recycling rate of nitrogen is approximately 10 per cent. Most of the nitrogen evaporates into the air as harmless nitrogen gas in wastewater treatment plant processes, the main goal of which is to remove nitrogen from the water ending up in the sea. The biggest nutrient loss in waste management is unsorted biowaste, which ends up in waste-to-energy plants among mixed waste. This accounts for about half of the nutrient streams of waste management.
An effective measure to improve the nutrient cycle of nitrogen and phosphorus would be, in particular, to increase the recycling of biowaste. Lots of efforts are made to achieve this, for example, through waste management regulations, communication and advice. Ways to reduce nitrous oxide emissions from wastewater treatment are also being studied. Based on full-scale test runs, increasing the alkalinity by increasing the dosage of lime and the dosing of additional carbon to the activated sludge process seem very promising at the Viikinmäki and Blominmäki treatment plants. The research on these processes will continue in order to optimise the dosage and to refine the costs of EUR/t and CO2eq.
Background for the nutrient balance calculation
One of HSY’s strategic goals is to promote a sustainable nutrient cycle in the Helsinki Metropolitan Area. This means that nutrients are treated as a scarce resource and their circulation is guaranteed as well as possible. The nutrients that are removed from the cycle eutrophicate water systems and contribute to global warming. In particular, non-renewable phosphorus must be recycled and phosphorus waste should not be generated at all. On the other hand, the usable form of nitrogen is also a valuable resource, the production of which uses significant amounts of energy outside the circular nutrient economy.
The actual cycle of nutrients is complicated, but the nutrient balance offers a simplified way of describing it. The nutrient balance shows HSY’s inbound and outbound nutrients, and these are used to form the so-called gate balance. The balance takes into account the means of removing the nutrients: do they enter the nutrient cycle in a usable form, or do they disappear as waste from the nutrient cycle and enter the environment.
Nutrient flows
Separately collected biowaste enters the nutrient cycle at the Ämmässuo biowaste treatment unit. Biowaste is treated by composting or digestion and the end product of the treatment is soil that contains nitrogen and phosphorus in a usable form. Some of the nitrogen evaporates into the air as nitrogen gas, as well as ammonia and nitrous oxide emissions, and some, in turn, drift with phosphorus to the wastewater sewer and from there to the wastewater treatment plant.
The amount of biowaste incinerated among mixed waste is evaluated using the results of the mixed waste composition study. The nutrients in this amount of biowaste are regarded as waste.
There is some nitrogen and very little phosphorus in the raw water entering the water treatment plant. The amount of nutrients varies by season. In the raw water treatment process, nutrients end up in the wastewater treatment plant among the precipitate and filter rinsing water, as well as to households among the purified supply water and from there to the wastewater treatment plant.
The nutrient streams treated at the wastewater treatment plant therefore include, in addition to (household) supply water, nutrient flows directed to the wastewater treatment plant in connection with composting and raw water treatment. The purpose of the wastewater treatment plant is to remove nutrients from the water before it is returned to the sea. Most of the nitrogen is removed from the water as nitrogen gas and some as nitrous oxide and ammonia in the air. Nitrogen that evaporates into the air is harmless in itself and does not cause any environmental load, while nitrogen load that ends up in the sea contributes to the eutrophication of water systems. Nutrients that end up in the sea should be closely monitored.
At the wastewater treatment plant, the purification process generates wastewater sludge, which is treated into a final product so that the nitrogen and phosphorus contained in return to the nutrient cycle in a reusable form. However, during the composting of the sludge, a small part of the nitrogen evaporates into the air, and also a small part of the nitrogen and phosphorus returns to the wastewater treatment plant with the wastewater released from the sludge.
Limitations
The quality of the nutrients returning to the cycle is not taken into account in the balance calculation. Due to the lack of data, the nutrient cycle of carbon has also not been taken into account in the indicator. The gate balance does not describe the use of the end products that have returned to the cycle, for example, the nutrient load of the use of compost soil is not taken into account.
The calculation of the indicator is based on widely measured average estimates, and, for example, the exact nutrient content of biowaste has not been measured separately. Furthermore, the nutrient balance measures only the nutrient flows that pass through HSY, and its results cannot therefore be used as a regional nutrient balance as such.